
4.6.2 Human Interaction
Each of the applications described in this section involve human interaction, in which computation is initiated by a user input and terminates when the resulting response has been transferred and displayed to the user. In most cases the response consists of a visualization of a modeling computation, either a single display frame or a sequence of frames depicting motion, with generation of the latter possibly continuing until the user's next input. All involve computation requiring one or more supercomputer-class machines, with a workstation used as the user input device. The workstations were typically also used for the display, but other display devices such as stand-alone high speed frame buffer displays and a CAVE visualization facility were used as well.
Dynamic Radiation Therapy Planning
This Vistanet testbed application explored the use of interactive distributed computation and visualization for medical treatment planning. A collaboration of physicians and computer science graphics researchers at the University of North Carolina investigated the problem of generating radiation treatment plans for cancer patients, using Vistanet's ATM/SONET network. The goal of the application was to enable physicians to interactively explore the space of 3D treatment plans for different numbers of radiation beams and placements, working with a computerized tomography (CT) scan of the patient obtained prior to the planning session. A more general research goal of this work was the exploration of new network-based graphics generation techniques.
Treatment planning up to this time was typically limited to two-dimensional planning of beam angles, shapes and other variables, which generally led to sub-optimal treatment plans. The premise for the Vistanet work was that 3D planning would allow more accurate treatment plans to be developed, significantly improving patient cure rates while reducing problems caused by irradiation of non-targeted regions of the body. Because of the very large exploration space created by 3D planning, however, an interactive visualization-based capability was required which would let a physician quickly find good solutions. A response time of at least one frame per second was considered necessary to make the system useable, with much faster rates desirable to allow continuous visual inspection as the orientation of the 3D display is changed.
To accomplish this, two major computational steps had to be carried out. First, the tissue radiation dosage resulting from a given set of beam parameters had to be calculated relative to the patient's CT scan, then the resulting 3D dose distribution data had to be rendered into a 3D volume visualization, with the computations under interactive control of the user.
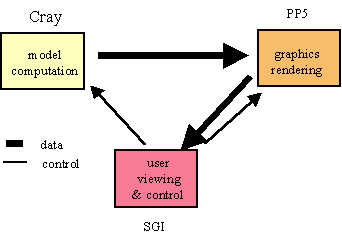
To provide the accuracy required in the results while attempting to meet the interactive response time constraints, three distinct machines were used -- an 8-processor Cray YMP located at MCNC, a specialized parallel-processor rendering machine called the Pixel Planes 5 (PP5) located in the UNC Computer Science department, and an SGI Onyx workstation located in the UNC Radiation Oncology department for physician interaction. Radiation dose data was computed on the Cray and sent to the PP5 for rendering, which sent the results to the SGI for display. User control inputs were sent from the SGI to the Cray to specify new beam parameters and to the PP5 for rendering control (Figure 4-22).
Figure 4-22. Radiation Treatment Planning

Both the Cray dose computations and PP5 rendering required more time for full accuracy than allowed by the one second per frame criteria (the PP5 was considered to be the most powerful rendering machine available relative to the 1990 time frame). To solve this problem within the processing power available at the time, a one-way computation pipeline was used in conjunction with progressive refinement and other rendering techniques. This allowed users to trade accuracy for speed of presentation, letting them move more rapidly through a set of beam placement choices. As the presentation reached a stationary state, the display was made more accurate.
Each display frame of dose data computed by the Cray resulted in from 4-8 MBytes of data sent to the PP5, with up to 3 MBytes per rendered frame sent by the PP5 to the SGI. Since approximately 500 Mbps of data throughput was available from the 622 Mbps ATM/SONET network link, sending 8 MBytes required approximately 0.13 seconds of transmission time. Thus, network bandwidth constrained the achievable frame rate to about 8 frames/second for the maximum data transfer conditions.
Letting the time required by the Cray to compute one frame of dose data define the pipeline computational granularity, a Cray rate of 1 frame/second provided 0.87 seconds of rendering time on the PP5. By adjusting the accuracy of its 3D volume rendering to match the available time, the rendering could be adapted to the current frame rate. This was accomplished through a combination of adaptive sampling, progressive refinement, and kinetic depth effect techniques developed by UNC researchers during the course of the project.
By using these and other techniques to maximize visualization detail within the imposed time constraints, the application successfully realized its goal of generating improved cancer treatment plans. More generally, it provided new insights into the importance of correct 3D perception in dealing with large and complex amounts of data through interactive visualization, and provided directions for further research in this area.
NCSA investigated a number of different supercomputer applications in the Blanca testbed, in order to gain an understanding of how their functionality can be best distributed for interactive visualization using a high speed network. During the course of the project, several high performance computers were available at NCSA: a Cray YMP, a TMC CM-2 and CM-5, a Convex 3880, and an SGI Power Challenge. In addition, the CAVE visualization facility developed by the University of Illinois became available in the latter part of the effort.
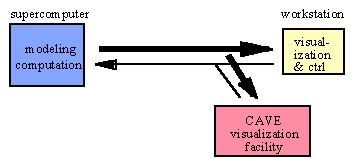
Much of their work was concerned with determining the data rates which could be sustained by different applications when optimized for a particular machine, with the applications partitioned to perform simulation computations on one machine and visualization rendering and display on a second machine, typically a high performance workstation (Figure 4-23).
Figure 4-23. Remote Visualization

An early experiment used a 3D severe thunderstorm modeling application running on a Cray YMP, to determine the maximum data rate which could be generated by the code. Using DTM for communications support, a rate of 143 Mbps was measured. The code was later ported to the CM-5 and then to the SGI Challenge, and the CAVE visualization system also used. The move to the higher-powered CM-5 in particular demonstrated the value of providing the visualization function on a physically separate machine from the modeling computations, since the CM-5 port required major restructuring of the modeling software for the highly parallel distributed memory CM-5 environment, while the visualization software remained constant and could be used with multiple modeling engines.
Other interactive-based work by NCSA included investigation of I/O rates for a cosmology modeling application. The results showed this application could generate output at a rate of 610 Mbps, requiring real-time transfer of the data to networked storage devices to avoid filling storage on the CM-5. Early work with a neurological modeling problem on the CM-2 showed that application capable of generating data at a rate of 1.8 Gbps; however, experiments which sent data from the CM-2 to a Convex 3880 over a HIPPI channel could achieve only about 120 Mbps, with CM2-HIPPI I/O and data parallel-serial transformation determined to be the bottlenecks. A general relativity application which modeled colliding black holes was run on both the CM-5 and SGI Challenge, with the Challenge used to perform visualization processing and transfer the results to the CAVE display system. Users could also steer the modeling computation from the CAVE.
The Space Science and Engineering Center (SSEC) at the University of Wisconsin also carried out remote visualization investigations within the Blanca testbed. Their work focused on creating a distributed version of Vis-5D, an existing single-machine program for interactively visualizing modeling results of the earth's atmosphere and oceans. Experiments were carried out over Blanca facilities using an SGI Onyx workstation at Wisconsin and three different supercomputers at NCSA: a 4-processor Cray YMP, a 32-processor SGI Challenge, and a TMC CM-5.
The resulting distributed version of Vis-5D partitioned the visualization functionality such that rendering was performed on the SGI workstation at the user's location, while more general computation such as isosurface generation was done on the remote supercomputer under interactive control of the workstation user. Experiments using the Cray YMP in dedicated mode showed a sustained transfer rate of 91 Mbps from the Cray to the SGI workstation, with queue size observations indicating that communication rather than computation was the bottleneck. Similar results were obtained using the SGI Challenge as the server, with a sustained rate of 55 Mbps measured.
For the CM-5, the Vis-5D server code was first ported to run in MIMD mode to maximize the isosurface generation rate. However, this approach could not be completed due to a lack of support for the MIMD mode's multiplexed I/O by the DTM communication software used for the experiments. A SIMD software port was pursued instead, but yielded poor performance -- it was found after further investigation that a critical aspect of the algorithm was executed serially by the hardware independently of the number of processors being used. Because of delays experienced in establishing an operational state for some of the facilities used for these experiments, time did not allow a resolution of these findings.
CALCRUST: Interactive Geophysics
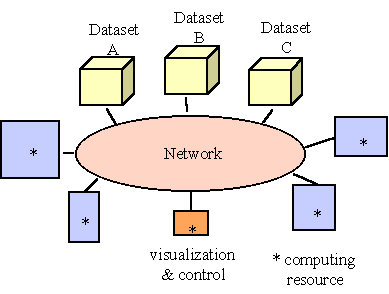
Researchers at JPL in the Casa testbed used an interactive geophysics application to investigate computationally intensive problems involving very large distributed datasets. The goal was to allow interactive 3D visualization of geographic data through the integration of three distinct data sources: Landsat satellite images, elevation data, and seismic data, with the data set sizes ranging from hundreds of megabytes to several gigabytes. This effort thus combined networked databases, distributed computation, and remote visualization in a single metacomputing application (Figure 4-24).
Figure 4-24. CALCRUST Metacomputing

In order to achieve reasonable interactivity, an elapsed time of one second or less was desired between the user's view selection and display of a static 3D rendering. For fly-by visualizations, the goal was to generate 10-15 frames per second. However, using a single computer such as the Cray C90 for all computations required on the order of 30 seconds to generate a single frame.
The nature of the 3D rendering processing made it well-matched to a highly parallel distributed memory machine such as the Intel Paragon, while shared-memory vector machines such as the Cray were a better match for 2D preprocessing of the very large raw data sets. By assigning the Landsat, elevation, and seismic 2D processing to different machines, a pipeline could be created which allowed the three datasets to be processed in parallel while their output was sent to a fourth machine for rendering, with the latter's output sent to a frame buffer or high-resolution workstation for display.
In experiments carried out using Casa machines and connectivity available at about the mid-point of the effort, a Cray C90 at SDSC and a Cray YMP at JPL were used for 2D processing, a 512-processor Intel Delta (a precursor to the Paragon) at Caltech was used for 3D rendering, and a workstation at JPL was used to provide visualization control and display. Using the Express control software developed as part of the Casa effort, a user at the workstation could initiate the processing pipeline on the other machines, with a wireframe or other low-resolution rendering used to select a new orientation or fly-by for high resolution display. A visualization software program called Surveyor was developed by JPL as part of this effort to allow the workstation and Intel Delta to be used interactively for terrain rendering.
Because of the processing-intensive nature of the problem, the best results which could be obtained from the above configuration involved a total latency of about 5 seconds to generate a single frame, with a corresponding frame rate of 0.2 frames/second for fly-by visualizations. The dominant component of this latency was the 2D processing on the Crays. The 3D processing was successfully parallelized on the Intel Delta through the replacement of a traditional ray-casting technique with a new ray identification approach. Although the Delta's I/O limitation of 5 Mbytes/second would have been an impediment to further speedups, it proved sufficient for these experiments due to the 2D processing bottleneck.
While the goal of less than one-second total latency was not achieved with the machine complement used for the experiments, the resulting metacomputer nevertheless provided a major advance relative to previous capabilities in this area, with the techniques subsequently applied to a high-resolution visualization of the California Landers earthquake. More generally, this work is expected to have wide applicability to the scientific evaluation of very large distributed datasets produced by systems such as NASA's Earth Observing System.